APGRADIENTTEST Procedure |
@APGRADIENTTEST applies the Andrews and Ploberger(1994) change point analysis to a more general type of model than the linear regression than the @APBreakTest procedure allows. The input to this are the series of gradients from maximum likelihood estimation. These can be fetched using the DERIVES option on instructions like MAXIMIZE or GARCH.
@APGRADIENTTEST( options ) start end
# list of derivative series
Parameters
|
start, end |
range for test. By default, the common range of the list of derivative series. |
Options
PI=fraction of entries on ends of sample not examined as break points [.15]
This is written assuming PI is .15. A different "pi" value than .15 would require a different table of entries to compute the approximate p-values.
GRAPH/[NOGRAPH]
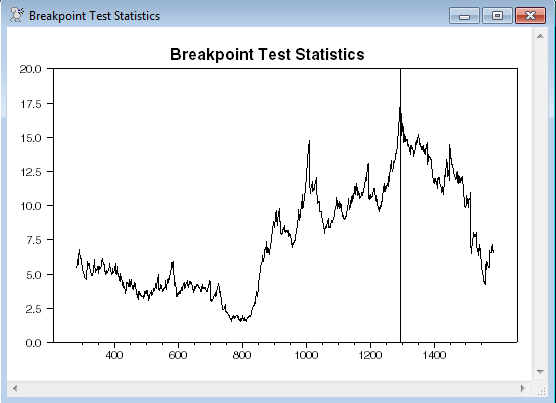
If GRAPH, the procedure produces a time-series graph of the breakpoint test statistics.
[PRINT]/NOPRINT
TITLE="title for output" ["Andrews-Ploberger Break Tests"]
Variables Defined
All are for the test on the full coefficient vector
|
%%BREAKPOINT |
Entry with largest break test (INTEGER) |
|
%%AQTEST |
Andrews-Quandt test statistic (REAL) |
|
%%APTEST |
Andrews-Ploberger test statistic (REAL) |
|
%%AQSIGNIF |
Approximate significance value for AQ test (REAL) |
|
%%APSIGNIF |
Approximate significance value for AP test (INTEGER) |
Example
This estimates a GARCH model, saving the derivatives and tests for breaks.
garch(p=1,q=1,hseries=hh11,derives=dd) / dlogdm
@apgradienttest(graph)
# dd
Sample Output
This starts with the output from the GARCH, since the order of the parameters in the test output is the same as on the GARCH.
GARCH Model - Estimation by BFGS
Convergence in 16 Iterations. Final criterion was 0.0000027 <= 0.0000100
Dependent Variable DLOGDM
Usable Observations 1866
Log Likelihood -2068.1265
Variable Coeff Std Error T-Stat Signif
************************************************************************************
1. Mean -0.020636536 0.015553819 -1.32678 0.18458061
2. C 0.016180183 0.005554235 2.91313 0.00357831
3. A 0.110126014 0.016373820 6.72574 0.00000000
4. B 0.868369483 0.020232859 42.91877 0.00000000
Andrews-Quandt Andrews-Ploberger
Test P-Val Date Test P-Val
1 12.982939 0.007 1296 3.623850 0.006
2 7.320293 0.090 1009 1.372721 0.117
3 3.224171 0.509 1296 0.518863 0.426
4 3.439964 0.468 1292 0.648551 0.341
All 18.171710 0.024 1296 5.499561 0.036
This indicates that there may be a problem with the mean of the model, which is the only parameter that shows a significant break.
Copyright © 2025 Thomas A. Doan