CROSSCORR Procedure |
@CROSSCORR computes and graphs cross correlations between two series. The graph is shown as a 2x2 matrix with autocorrelations for the series in the diagonal slots and the cross correlations in the off-diagonal with the leads in one corner and lags in the other.
@CrossCorr( options ) series1 series2 start end
Parameters
|
series1 , series2 |
the series for which you want to calculate cross–correlations. |
|
start, end |
range to use. By default, the common range of series1 and series2. |
Options
NUMBER=number of autocorrelations to compute [depends upon data]
[GRAPH]/NOGRAPH
REPORT/[NOREPORT]
PRINT/[NOPRINT]
These control what types of output are produced. GRAPH produces the 2x2 matrix of graphs. REPORT generates a report window and PRINT puts a text table into the output window.
SPIKE/[NOSPIKE]
If you do a GRAPH, these controls whether the correlations are shown as a bar graph (default) or as thinner "spikes".
WINDOW="title for graph window" ["Cross correlations of series1 and series2"]
Example
*
* Brockwell & Davis, Introduction to Time Series and Forecasting, 2nd ed.
* Example 7.1.1 from pp 225-228
*
open data djao2.dat
data(format=prn,org=columns) 1 251 dj ao
*
graph(footer="Figure 7.1 Dow Jones Index and Australian All Ordinaries Index") 2
# dj
# ao
*
set djpc = 100*(dj-dj{1})/dj{1}
set aopc = 100*(ao-ao{1})/ao{1}
@bjident(diffs=0,number=40) djpc
@bjident(diffs=0,number=40) aopc
*
@crosscorr(number=20) aopc djpc
Sample Graph
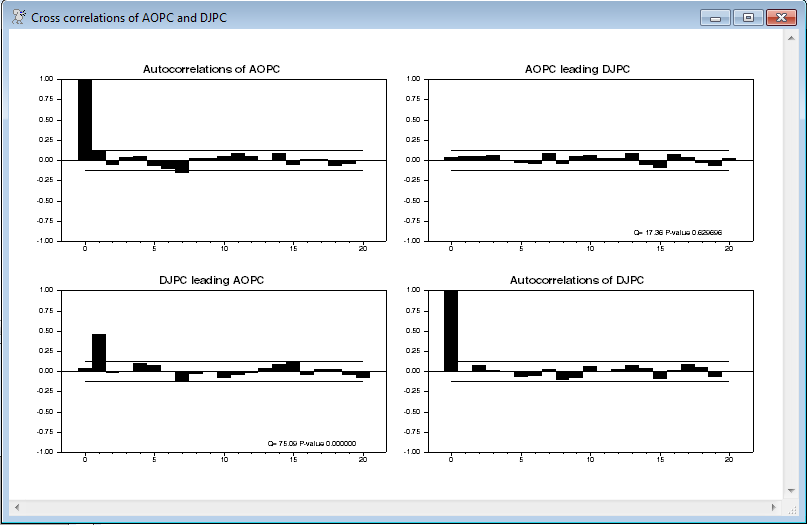
The top left and bottom right graphs are the autocorrelations. The top right has the first series (here AOPC) leading the second (DJPC), while the bottom left has the second series leading the first. The horizontal lines are the asymptotic 2 standard error bands assuming that the data are serially and jointly uncorrelated. In this case, the one apparently statistical significant effect is DJPC leading AOPC by one period.
Copyright © 2025 Thomas A. Doan