CUSUMTESTS Procedure |
@CusumTests performs performs CUSUM and CUSUMQ tests from Brown, Durbin & Evans(1975) on the input series, which should be a series of recursive residuals. The significance level on the CUSUM test is from Zeileis(2004), while the critical boundaries for the CUSUMQ test is from Edgerton & Wells(1994).
@CusumTests( options )resids start end
Options
FOOTER="graph footer" ["CUSUM Tests"]
HEADER="graph header" [none]
Variables Defined
|
%CDSTAT |
value of the CUSUM statistic (maximum absolute value) (REAL) |
|
%SIGNIF |
(approximate) significance level of the CUSUM (REAL) |
|
%%CUSUMQ |
value of CUSUMQ statistic (maximum absolute gap) (REAL) |
|
%%CUSUMQCV |
.05 critical value for CUSUMQ (REAL) |
Example
*
* Baltagi, Econometrics, 3rd edition
* CUSUM test from p 201
*
open data consump.dat
cal(a) 1950
data(format=prn,org=columns) 1950:1 1993:1
*
rls(csum=cusum,csquared=cusumsq,dfhist=dfs) c / rresids
# constant y
*
* CUSUM test. The CUSUMTests procedure does both the CUSUM and the
* CUSUMQ (squared) tests taking a set of recursive residuals as the
* input.
*
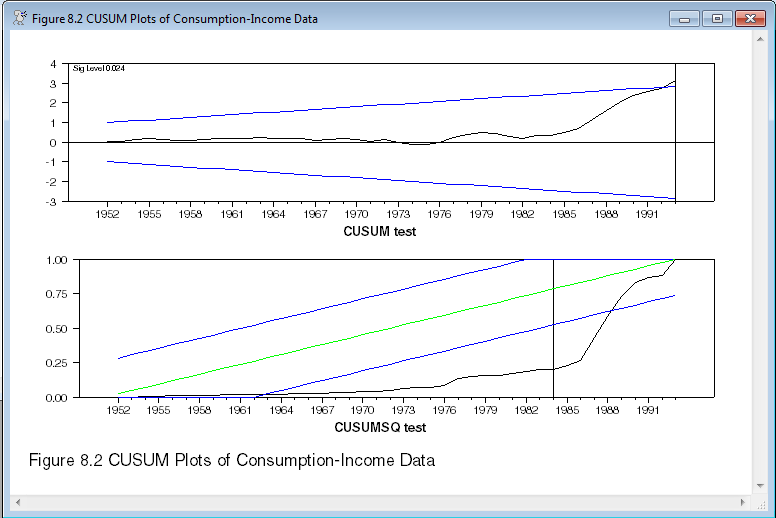
@CusumTests(footer="Figure 8.2 CUSUM Plots of Consumption-Income Data") rresids
Sample Output
The top graph is the CUSUM test, which tests primarily for a break in the model itself, and the CUSUMSQ test which tests primarily for a break in the residual variance. The vertical lines mark the largest deviation. The expected value for the CUSUM is zero, while for CUSUMSQ, it's the green line. In both cases, the blue lines show the .05 limits for deviations. The CUSUM test seems to indicate a possible problem right near the end of the data, while the CUSUMSQ test rather strongly rejects model stability.
Copyright © 2025 Thomas A. Doan