REGCORRS Procedure |
@RegCorrs performs an autocorrelation analysis on a series of residuals, similar to those typically done after estimating an ARIMA model.
@RegCorrs( options ) resids
Parameters
|
resids |
(input) series of residuals. If omitted, uses the %RESIDS series |
Options
NUMBER=number of autocorrelations to compute [depends upon number of data points]
METHOD=[YULE]/BURG
[GRAPH]/NOGRAPH
Graph the correlations
REPORT/[NOREPORT]
PRINT/[NOPRINT]
Include printed output from the correlations
TITLE="title of graph window and report window"
HEADER="header string for graph"
FOOTER="footer string for graph"
QSTATS/[NOQSTATS]
Computes and displays Ljung-Box Q Statistics
DFC=degrees of freedom correction for Q statistics
SPAN=width of test intervals [1]
[CRITERIA]/NOCRITERIA
Computes and displays the information criteria
Variables defined
|
%AIC |
Akaike Information Criterion (REAL) |
|
%SBC |
Schwarz Bayesian Criterion (REAL) |
Example
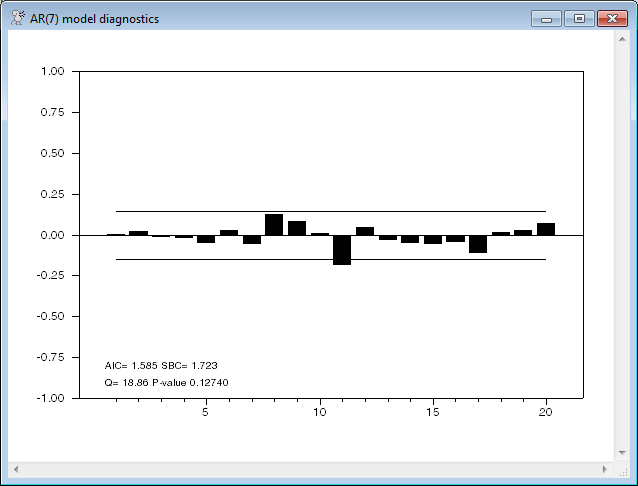
This estimates an AR(7) model and uses @REGCORRS to examine the autocorrelation of the residuals. This uses the DFC=%NARMA option (%NARMA will be 7) to correct the degrees of freedom on the Q for the seven ARMA parameters used.
boxjenk(constant,ar=7) spread 1961:4 *
*
@regcorrs(dfc=%narma,number=20,qstats,report,$
method=burg,title="AR(7) model diagnostics")
Sample Output
These are the results from the REPORT option. Note that the "Q Signif" is blank until lag 8 because 7 degrees of freedom are lost. After that, the Q's are floating around the standard rejection limit of .05. As you can see in the graph below, the AR(7) model manages to fairly well remove the autocorrelation of the first seven lags, but has problems just past that point.
Lag Corr Partial LB Q Q Signif
1 0.000 0.000 0.000031
2 0.024 0.024 0.108430
3 -0.014 -0.014 0.146041
4 -0.021 -0.022 0.230212
5 -0.049 -0.048 0.688489
6 0.026 0.027 0.820999
7 -0.058 -0.056 1.470848
8 0.124 0.122 4.501357 0.0339
9 0.080 0.082 5.777170 0.0557
10 0.012 0.003 5.803670 0.1216
11 -0.184 -0.191 12.603911 0.0134
12 0.048 0.051 13.071935 0.0227
13 -0.033 -0.005 13.286264 0.0387
14 -0.054 -0.063 13.877188 0.0534
15 -0.061 -0.061 14.628409 0.0668
16 -0.045 -0.063 15.045535 0.0897
17 -0.111 -0.124 17.614942 0.0618
18 0.016 -0.020 17.669738 0.0896
19 0.030 0.088 17.862936 0.1199
20 0.069 0.089 18.863287 0.1274
Copyright © 2025 Thomas A. Doan