|
Examples / EXPSMOOTH1.RPF |
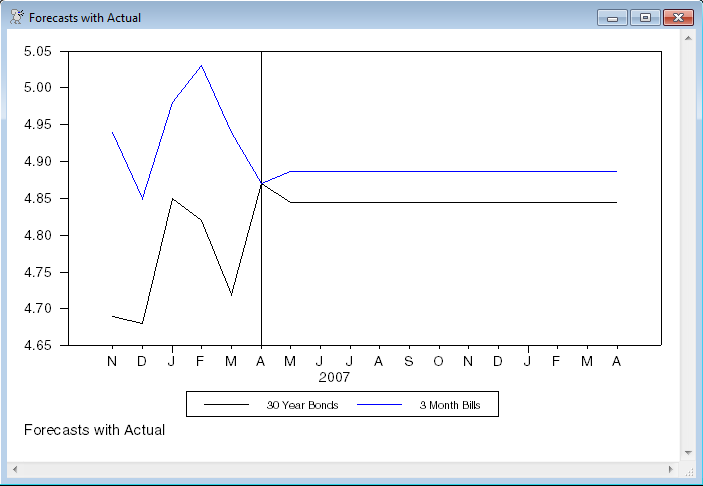
EXPSMOOTH1.RPF demonstrates the use of the ESMOOTH instruction for exponential smoothing. It does out-of-sample forecasts for monthly data on US 30 year Treasury Bonds (FCM30) and 3-month Treasury Bills (FTBS3).
These forecast 12 steps out, using a simple smoothing model with a fixed parameter of .8. It appends the forecasts to the series for ease in graphing:
esmooth(alpha=.8,forecast=ftbs3,steps=12) ftbs3
esmooth(alpha=.8,forecast=fcm30,steps=12) fcm30
This does a graph with more informative key labels, showing the last six months of actual data, followed by the forecasts. It includes a vertical line at 2007:4 (the end of actual data).
graph(grid=(t==2007:4),key=below, $
klabels=||"30 Year Bonds","3 Month Bills"||) 2
# fcm30 2006:11 2008:4
# ftbs3 2006:11 2008:4
Full Program
open data haversample.rat
calendar(m) 1978
data(format=rats) 1978:1 2007:4 fcm30 ftbs3
*
* FCM30 = Yield on 30 Year Treasury Bonds
* FTBS3 = Yield on 3 Month Treasury Bills
*
* Forecast twelve periods out-of-sample using simple smoothing model
* with fixed parameter of .8. Append the forecasts to the series for
* ease in graphing.
*
esmooth(alpha=.8,forecast=ftbs3,steps=12) ftbs3
esmooth(alpha=.8,forecast=fcm30,steps=12) fcm30
*
* Graph with more informative key labels, showing the last six months of
* actual data, followed by the forecasts. Include a vertical line at
* 2007:4.
*
graph(grid=(t==2007:4),key=below,footer="Forecasts with Actual", $
klabels=||"30 Year Bonds","3 Month Bills"||) 2
# fcm30 2006:11 2008:4
# ftbs3 2006:11 2008:4
Graph
Copyright © 2026 Thomas A. Doan