REGACTFIT Procedure |
@REGACTFIT is a post-processor for a linear regression which graphs actual/fitted and residuals in separate vertical zones on the same box. To use it, do a LINREG (or any other univariate least squares estimator) then do @REGACTFIT immediately after.
@REGACTFIT( options ) (no parameters)
Options
HEADER="string for header" ["Actual/Fitted and Residuals" if neither HEADER nor FOOTER]
FOOTER="string for footer"
Example
*
* Diebold, Elements of Forecasting, 3rd edition
* Retail sales examples from pp 90-98
*
cal(m) 1954:1
open data rsales.dat
data(format=prn,org=columns) 1954:1 1994:12
*
graph(footer="Figure 4.14 Retail Sales")
# rsales
*
set time = t
set time2 = t^2
*
linreg rsales 1955:1 1993:12
# constant time
@regcrits
@regactfit(footer="Figure 4.15 Retail Sales: Linear Trend Residual Plot")
*
linreg rsales 1955:1 1993:12
# constant time time2
@regcrits
@regactfit(footer="Figure 4.16 Retail Sales: Quadratic Trend Residual Plot")
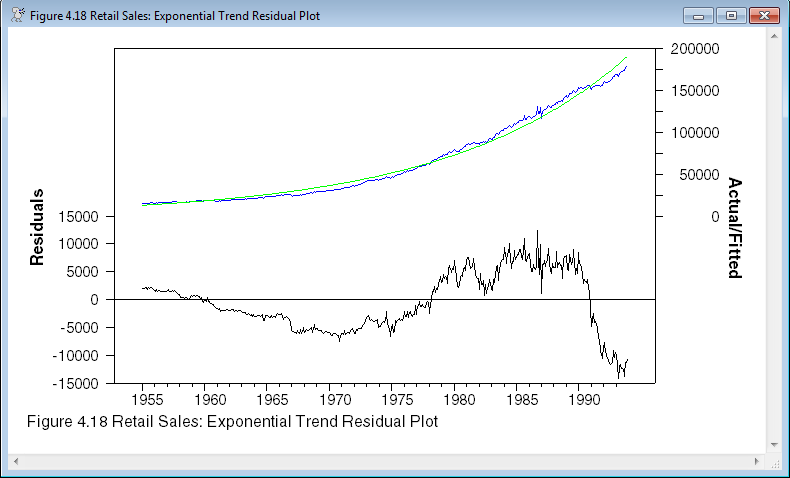
Sample Graph
The top section of the graph is the actual/fitted graph (blue is actual), while the bottom has the residuals.
This shows rather clearly modeling the data as a quadratic trend on the levels doesn't work well as the residuals have a much greater absolute value late in the data set when the values of the data are high. A regression on a log transformation would likely work much better.
Copyright © 2026 Thomas A. Doan