HISTOGRAM Procedure |
@HISTOGRAM computes and displays a density histogram for a series.
@Histogram( options ) series start end
Parameters
|
series |
series to analyze |
|
start, end |
range to use. By default, the defined range of series |
Options
DISTRIB=[NONE]/NORMAL
For DISTRIB=NORMAL, shows an overlay of the normal density.
STATS/[NOSTATS]
With STATS, displays series statistics in the margin
HLABEL="horizontal axis label" [not used]
VLABEL="vertical axis label" [not used]
HEADER="header label" [not used]
FOOTER="footer label" [not used]
COUNTS/[NOCOUNTS]
Computes and displays counts in each bin rather than density
MAXGRID=maximum number of bins [25]
VMAX=maximum value for graph
XGRID=series for grid boundaries [not used]
Example
*
* Pindyck & Rubinfeld, Econometric Models and Economic Forecasts, 4th edition
* Example 3.5 from page 78
*
open data ex35.xls
data(format=xls,org=columns) 1 50 obs enb env
*
linreg enb
# constant env
*
stats(fractiles) %resids
*
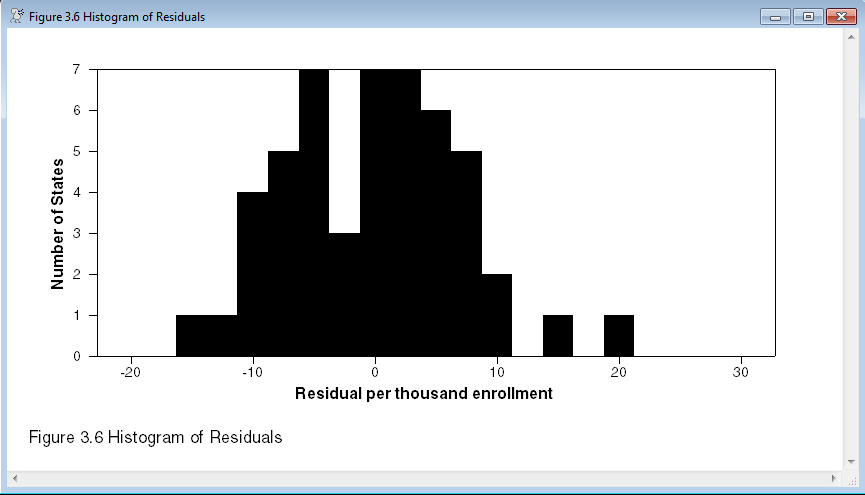
@histogram(footer="Figure 3.6 Histogram of Residuals",$
hlabel="Residual per thousand enrollment",$
vlabel="Number of States",maxgrid=16,counts) %resids
Sample Graph
This is from the example above. With just 50 data points, 16 grid points is really too many which shows in the graph.
Copyright © 2025 Thomas A. Doan