|
Examples / BOOTSPECTRUM.RPF |
BOOTSPECTRUM.RPF is an example of bootstrapping a spectral density, using the method described in Franke and Hardle(1992).
Full Program
open data sunspots.dat
calendar 1770
data(format=free,org=columns) 1770:1 1869:1 sunspots
*
diff(center) sunspots / cspots
compute nobs=%allocend()
*
* <<nwidth>> is the window width to be used in estimation.
* <<nwidthboot>> is the window width to be used to standardize the
* periodogram for bootstrapping. These can be different.
*
compute nwidth=9
compute nwidthboot=9
*
freq 5 nobs
rtoc
# cspots
# 1
*
* Compute the periodogram back into complex series 1. We need this for
* bootstrapping.
*
fft 1
cmult(scale=1.0/(2*%pi*nobs)) 1 1
*
* Get the smoothed estimate with the desired width to complex series 2.
*
window(type=tent,width=nwidth) 1 / 2
*
* Get the smoothed estimate with the width for bootstrapping to complex
* series 5.
*
window(type=tent,width=nwidthboot) 1 / 5
compute nboot=1000
*
* The reshuffled periodogram needs to be symmetrical, so we only use
* half the ordinates. Because the 0 ordinate in the periodogram is
* forceably zero (as a result of de-meaning), we also leave that out.
*
compute nshuffle=nobs/2+1
*
* We need to bootstrap the periodogram divided by the estimated
* spectral density using the width <<nwidthboot>>.
*
set source = %real(%z(t,1))/%real(%z(t,5))
*
set sumsqr 1 nobs = 0.0
*
do draw=1,nboot
*
* Draw a set of standardized periodogram ordinates. Normalize to mean
* one and symmetrize.
*
boot shuffle 2 nshuffle
cset 3 1 nshuffle = %if(t==1,0.0,source(shuffle(t)))
sstats(mean) 2 nshuffle %real(%z(t,3))>>shufflesum
cset 3 1 nshuffle = %z(t,3)/shufflesum
@cseriessymm 3
*
* Recolor it by the standardizing spectral estimate.
*
cset 3 = %z(t,3)*%z(t,5)
*
* Smooth using the desired width.
*
window(type=tent,width=nwidth) 3 / 4
*
* Get sample statistics with respect to log ratio to the original
* spectral density estimate.
*
set sumsqr 1 nobs = sumsqr+log(%real(%z(t,4))/%real(%z(t,2)))^2
end do draw
*
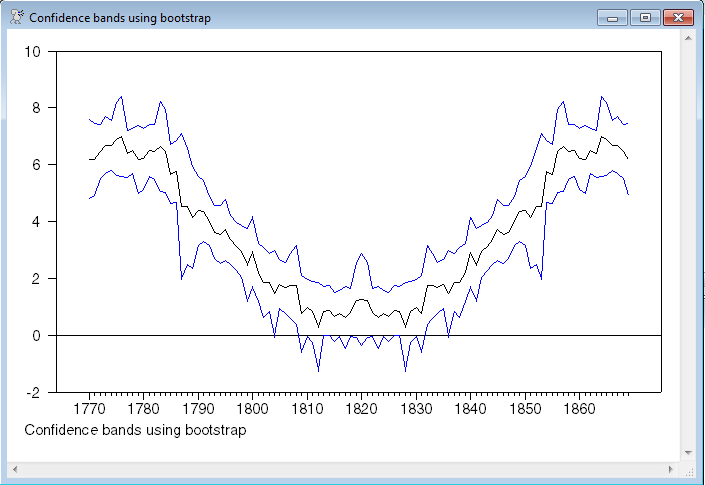
set logspect 1 nobs = log(%real(%z(t,2)))
set lower 1 nobs = logspect-2.0*sqrt(sumsqr/nboot)
set upper 1 nobs = logspect+2.0*sqrt(sumsqr/nboot)
graph(footer="Confidence bands using bootstrap") 3
# logspect
# lower / 2
# upper / 2
*
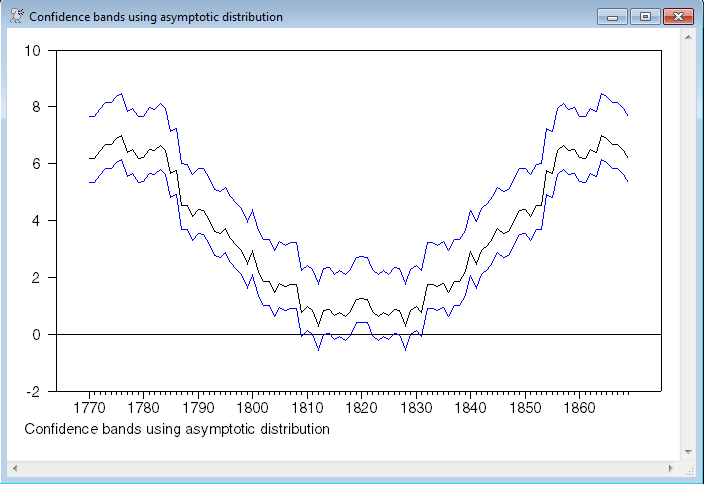
set loweradt = logspect+log(%edf/%invchisqr(.025,%edf))
set upperadt = logspect+log(%edf/%invchisqr(.975,%edf))
graph(footer="Confidence bands using asymptotic distribution") 3
# logspect
# loweradt / 2
# upperadt / 2
Graphs (there is no other output)
Copyright © 2026 Thomas A. Doan