|
Examples / DLMEXAM4.RPF |
DLMEXAM4.RPF is an example of conditional simulation of a state-space model. This uses the model for Nile river flow data common to the four simple DLM examples.
Most uses of TYPE=CSIMULATE will be more complicated, but this gives some idea of how to get information out of the simulations. This Kalman smooths through the data, and uses the WHAT and VHAT options to save smoothed estimates of the \(\bf{W}\) and \(\bf{V}\).
There are many (an infinite number) of combinations of \(\bf{W}\) and \(\bf{V}\) shocks that will produce the observed data. Kalman smoothing computes the “most likely” (highest density) set of shocks. Conditional simulation draws from the joint distribution for which the smoothed estimates are the mean. With TYPE=CSIMULATE, the WHAT and VHAT options give the simulated values for the shocks.
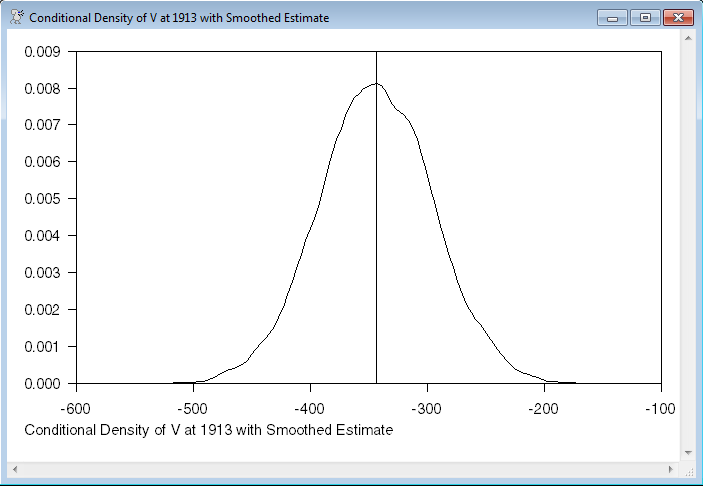
This saves the values for one specific data point (1913, which is a fairly large outlier) and graphs the density for V(1913:1) of the simulated draws.
dlm(a=1.0,c=1.0,sv=15099.0,sw=1469.1,presample=diffuse,$
y=nile,type=smooth,what=what,vhat=vhat) / xstates vstates
compute ndraws=10000
set what_h 1 ndraws = 0.0
set vhat_h 1 ndraws = 0.0
do draw=1,ndraws
dlm(a=1.0,c=1.0,sv=15099.0,sw=1469.1,presample=diffuse,$
y=nile,type=csimulate,what=what_s,vhat=vhat_s)
compute what_h(draw) = what_s(1913:1)(1)
compute vhat_h(draw) = vhat_s(1913:1)(1)
end do draw
density(smoothing=1.5) vhat_h 1 ndraws xv fv
scatter(hgrid=vhat(1913:1)(1),style=lines,footer=$
"Conditional Density of V at 1913 with Smoothed Estimate")
# xv fv
Full Program
open data nile.dat
calendar 1871
data(format=free,org=columns,skips=1) 1871:1 1970:1 nile
*
* Kalman smooth through the data period, saving the smoothed estimates
* for the W and V shocks.
*
dlm(a=1.0,c=1.0,sv=15099.0,sw=1469.1,presample=diffuse,y=nile,$
type=smooth,what=what,vhat=vhat) / xstates vstates
*
* Conditionally simulate 10000 realizations, saving the simulated values
* for W and V at 1913:1 (location of a fairly large negative outlier).
*
compute ndraws=10000
set what_h 1 ndraws = 0.0
set vhat_h 1 ndraws = 0.0
do draw=1,ndraws
dlm(a=1.0,c=1.0,sv=15099.0,sw=1469.1,presample=diffuse,y=nile,$
type=csimulate,what=what_s,vhat=vhat_s)
compute what_h(draw)=what_s(1913:1)(1)
compute vhat_h(draw)=vhat_s(1913:1)(1)
end do draw
*
density(smoothing=1.5) vhat_h 1 ndraws xv fv
scatter(hgrid=vhat(1913:1)(1),style=lines,footer=$
"Conditional Density of V at 1913 with Smoothed Estimate")
# xv fv
Graph
Copyright © 2026 Thomas A. Doan