|
Graphics / Graphing Functions |
If you want to graph a function \(y = f(x)\), use the instruction SCATTER. Create a grid series with \(x\) values and a corresponding series of \(y\) values. SCATTER with the option STYLE=LINE will create the graph. You can also use other style choices, such as BAR and POLYGONAL. In general, you should not need more than about 100 grid points on the x-axis for a smooth function. (The graph is done by, in effect, linear interpolation between the points). Note that the LINE, BAR and POLYGONAL styles on SCATTER only work correctly if the \(x\) series is sorted into increasing order.
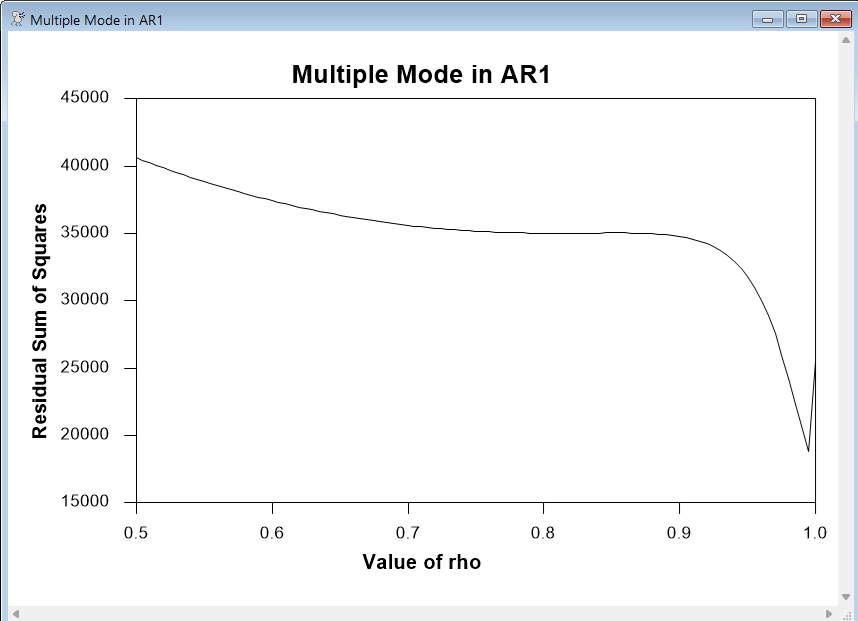
GRAPHFUNCTION.RPF computes a series of AR1 regressions for a grid series of values for \(\rho\) (RHOS) and graphs the corresponding residual sum of squares (series RSS) against that.
scatter(style=lines,vlabel="Residual Sum of Squares",hlabel="Value of rho",header="Multiple Mode in AR1")
# rhos rss
Copyright © 2026 Thomas A. Doan