|
Examples / GRAPHFUNCTION.RPF |
GRAPHFUNCTION.RPF is an example of graphing a general function.
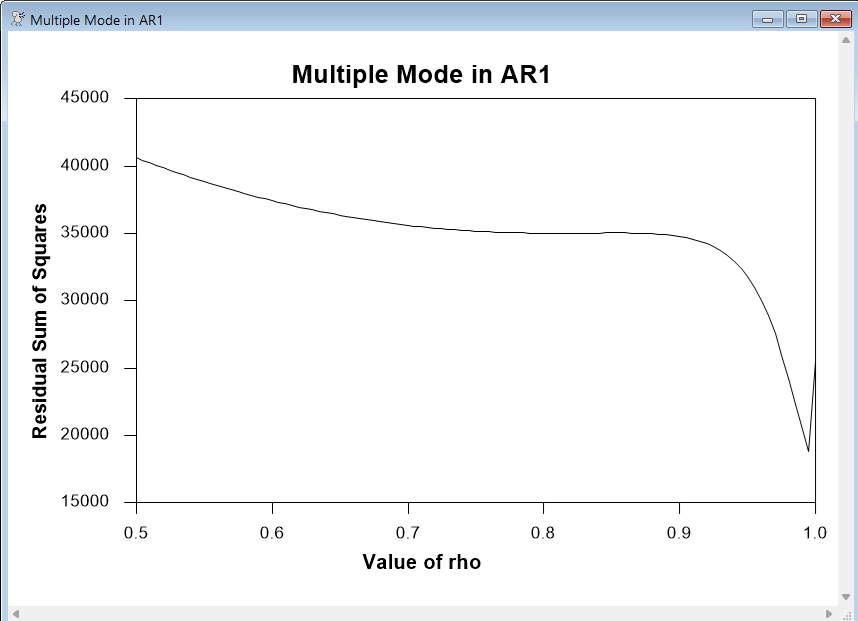
This examines the estimation of a regression with autocorrelated errors, doing a full grid search over values of \(\rho\) for values from .5 to 1.0. It turns out that there are two local modes, one (barely perceptible) at around .81 and one rather obvious at around .99. Depending upon the method used for estimating the model, you could end up with either.
The model is estimated using AR1 for the series INVEST on several variables.
This uses the @GRIDSERIES procedure to generate a series of the values of \(\rho\) for which we will evaluate the model (as our "x" series). It's a rather fine grid (spacing of .005). The PTS option is used to return the number of elements in the series, so we don't have to count them ourselves. We then clear out a series for the sums of squared residuals (which will be our "y" series).
@GridSeries(from=.5,to=1.0,size=.005,pts=gpts) rhos
set rss 1 gpts = 0.0
This is the work loop for the calculation. It does an AR1 using the RHO option to input each of the test values in turn. (It uses NOPRINT, since we don't need to see 100+ regressions) and saves the %RSS value into the proper slot in the RSS series.
do i=1,gpts
ar1(noprint,rho=rhos(i)) invest 1950:1 1985:4
# constant ydiff{1} gnp rate{4}
compute rss(i)=%rss
end do i
and this uses SCATTER to produce the graph of the function, done by (in effect) linear interpolation between the points.
scatter(style=lines,vlabel="Residual Sum of Squares",hlabel="Value of rho",header="Multiple Mode in AR1") 1
# rhos rss
Full Program
open data prsmall.xls
cal(q) 1947:1
data(format=xls,org=obs) 1947:1 1988:1
*
set ydiff = gnp-gnp{1}
set rsum = rate+rate{1}
set mdiff = m-m{1}
*
@GridSeries(from=.5,to=1.0,size=.005,pts=gpts) rhos
set rss 1 gpts = 0.0
do i=1,gpts
ar1(noprint,rho=rhos(i)) invest 1950:1 1985:4
# constant ydiff{1} gnp rate{4}
compute rss(i)=%rss
end do i
scatter(style=lines,vlabel="Residual Sum of Squares",hlabel="Value of rho",header="Multiple Mode in AR1") 1
# rhos rss
Graph
Copyright © 2026 Thomas A. Doan