GRTEXT Instruction |
GRTEXT( options ) string
GRTEXT adds text to a GRAPH, SCATTER, or GCONTOUR plot at a location inside the graph boundary. GRTEXT can only be used in an SPGRAPH block.
Usage
The basic procedure is:
1.Use SPGRAPH to initiate the special graph.
2.Use GRAPH, SCATTER or GCONTOUR to draw the graph.
3.Use one or more GRTEXT instructions to add text to the graph created in step 2. Use one GRTEXT for each string you want to add.
4.If you are putting multiple graphs on the page (by using the HFIELDS and VFIELDS options on SPGRAPH), repeat steps 2 and 3 as necessary to draw the other graphs and, if desired, add text to those graphs.
5.Issue the SPGRAPH(DONE) instruction to complete the special graph.
It's usually a good idea to do the graph first to decide where you want the added text. (GRTEXT should usually be the final step when preparing a graph for publication). The best choice for the ALIGNMENT and DIRECTION options may not be apparent until you see how the graph lays out.
Parameters
|
string |
The string of text you want to add to the graph. This can be a string of text enclosed in quotes, or a STRING or LABEL type variable. You can include line breaks by inserting the characters \\\\ in the string at the points where you want line breaks. |
Options
POSITION=UPLEFT/UPRIGHT/LOLEFT/LORIGHT/RIGHTMARGIN/BOTTOMMARGIN/LEFTMARGIN/TOPMARGIN
ENTRY=entry number or date for x-axis position (used with GRAPH)
X=x-axis value for x-axis position (used with SCATTER or GCONTOUR)
Y=y-axis value for y-axis position (with GRAPH, SCATTER, or GCONTOUR)
By default, the text will be centered in the graph. You can use these options to control the positioning of the text.
The POSITION option puts the text in one of the corners of the graph box (upper left, upper right, lower left, lower right), or in one of the margins of the graph. To use any of the “margin” options, you need to do the GRTEXT before the graphing instruction.
ENTRY and Y (for GRAPH) or X and Y (for SCATTER or GCONTOUR) allow you to place the text at a specific location to annotate some feature. The ALIGNMENT, VALIGNMENT, and DIRECTION options described below control placement of the string relative to the location you provide.
If you are doing a GRAPH, you use the ENTRY option to set the horizontal position as a date or entry number, and the Y option to set the vertical position of the strings, within the Y-axis range.
If you are doing a SCATTER or GCONTOUR, you use the X option to specify the horizontal position within the X-axis range, and the Y option to specify the vertical position within the Y-axis range.
ALIGNMENT=[CENTERED]/RIGHT/LEFT
VALIGNMENT=[CENTERED]/TOP/BOTTOM
DIRECTION=compass heading in degrees (integer from 0 to 360)
ALIGNMENT determines whether the text should be centered or right- or left-justified at the starting position. VALIGNMENT determines whether the starting position will give the vertical center, the top or bottom.
DIRECTION allows you to position the text by specifying a direction from the (x,y) point as a compass heading in degrees. For example, DIRECTION=0 (or 360) will center the text at a point just above the (x,y) location; DIRECTION=45 will display left-justified text, starting just above and to the right of the (x,y) location; DIRECTION=270 will display right-justified text directly to the left of the (x,y) point.
FONT=name of font to use
SIZE=relative size of type in points
These select the typeface and size of the string. The default point size is 14 points. See Graph Labels: Fonts and Line Breaks for details.
BOLD/[NOBOLD]
ITALICS/[NOITALICS]
These allow you to select bold and/or italics type styles.
BOX/[NOBOX]
The BOX option adds a box around the text.
TRANSPARENT/[NOTRANSPARENT]
GRTEXT strings are normally displayed with an opaque white background, so any lines, patterns or symbols lying “under” the string will be obscured from view. With TRANSPARENT, only the text itself will be opaque—all the white space within and between letters will be transparent, allowing any underlying graph elements to show through.
Examples
This adds two GRTEXT strings to identify the two lines.
spgraph
graph(nodates,footer="Figure 4.2 Increasing and Decreasing Linear Trends") 2
# mtrend
# ptrend
*
* GRTEXT puts text on the previous graph. The Y option indicates the y
* value (on the scale of the graph) and ENTRY the time period at which
* the text is to be placed. If you're annotating a SCATTER graph, you
* use Y and X to set the location.
*
grtext(y=15,entry=10,align=left) "Trend=10-.25*Time"
grtext(y=-40,entry=20,align=left) "Trend=-50+.8*Time"
spgraph(done)
This adds a GRTEXT string to identify the GRID option line. The string is shown across three lines using the \\\\ line delimiter inside the string.
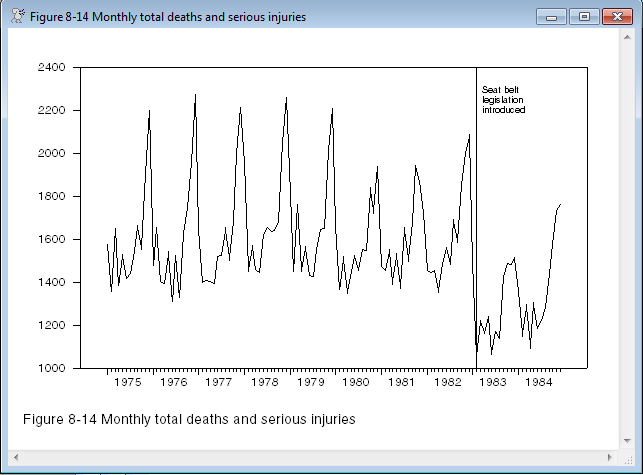
spgraph(footer="Figure 8-14 Monthly total deaths and serious injuries")
graph(grid=(t==1983:2))
# deaths
grtext(entry=1983:4,y=2200,align=left) "Seat belt \\\\legislation \\\\introduced"
spgraph(done)
Sample Graph
This is the graph produced by the second example. As mentioned above, you probably would want to do the graph first without the added text as the best location wouldn't be clear. Here, choosing 2200, left alignment puts it well above any data, and ENTRY=1983:4 puts it just to the right of the grid line, while leaving at least a bit of a gap for readability.
Copyright © 2026 Thomas A. Doan