|
Examples / SPGRAPH.RPF |
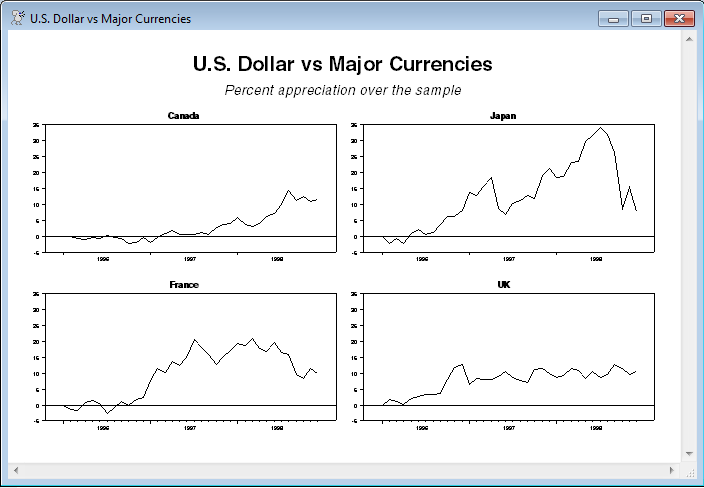
SPGRAPH.RPF is an example of a graph with multiple panes on a single page, using the SPGRAPH instruction.
This graphs the exchange rate of the dollar versus four foreign currencies. These are first given a common reference by converting them to percentage appreciation of dollars per foreign unit since the start of the sample. As all but the UK series (GBRUSXSR) are originally stated in foreign currency per dollar, they have to be flipped. We then use TABLE to get the maximum and minimum values attained across all the countries, and use these as the MAX and MIN on each GRAPH. This ensures that the very modest movements relative to the Canadian dollar aren’t exaggerated relative to the much larger movement versus the yen.
A HASH[STRINGS] is used to give more readable labels to the series, naming them by their country instead of the database coding. The HASH key is the series name, so NiceLabels(%l(i)) inside the loop gets the string associated with the series to which the I index points.
Full Program
cal(m) 1996
open data oecdsample.rat
data(format=rats) 1996:1 1998:12 canusxsr frausxsr jpnusxsr gbrusxsr
*
* Flip to dollars per foreign unit and assign descriptive labels
*
set canusxsr = 1.0/canusxsr
set frausxsr = 1.0/frausxsr
set jpnusxsr = 1.0/jpnusxsr
*
dec hash[strings] NiceLabels
compute NiceLabels("canusxsr")="Canada"
compute NiceLabels("frausxsr")="France"
compute NiceLabels("jpnusxsr")="Japan"
compute NiceLabels("gbrusxsr")="UK"
*
* Convert to percent appreciation
*
dofor i = canusxsr frausxsr jpnusxsr gbrusxsr
compute base=([series]i)(1996:1)
set i = 100*(i{0}/base - 1.0)
end dofor i
*
* Use TABLE to get the maximum and minimum across all series
*
table(noprint) / canusxsr frausxsr jpnusxsr gbrusxsr
*
* Set up the SPGRAPH for a 2x2 matrix
*
spgraph(vfields=2,hfields=2,header="U.S. Dollar vs Major Currencies",$)
subheader="Percent appreciation over the sample")
dofor i = canusxsr frausxsr jpnusxsr gbrusxsr
graph(max=%maximum,min=%minimum,header=NiceLabels(%l(i)))
# i
end dofor
spgraph(done)
Graph
Copyright © 2026 Thomas A. Doan