|
Graphics / Contour Graphs (GCONTOUR) |
The GCONTOUR instruction generates contour plots. Its design is quite different from GRAPH and SCATTER, because it needs the x and y values to be in the form of a grid, and the function values must be a matrix with dimensions size of x grid by size of y grid. This matrix is usually created using the instruction EWISE, which fills an array based on a function of the row and column numbers.
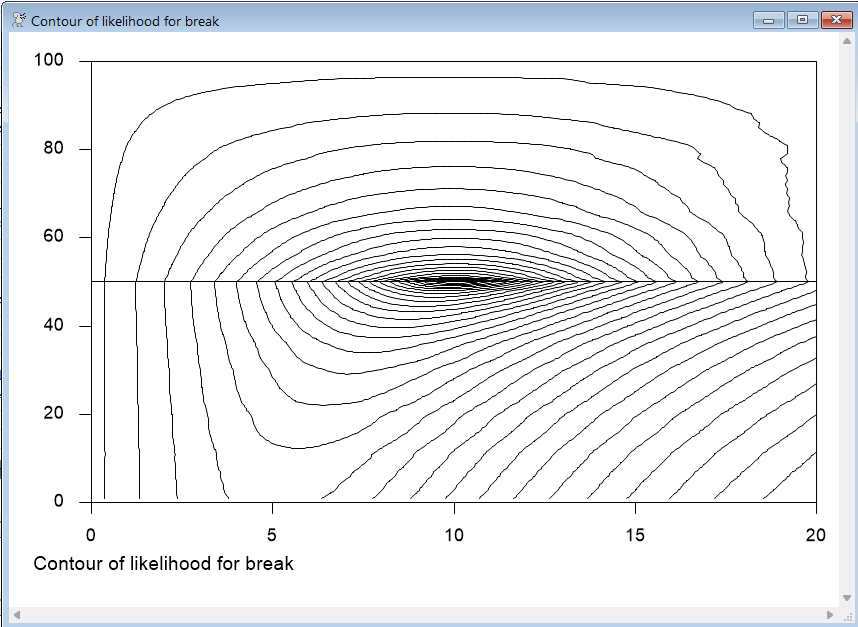
The following is taken from the file GCONTOUR.RPF. This analyzes the log likelihood of a model with a break point in the mean as a function of the location of the break point (shown on the y axis) against the mean of the post break process (x axis).
This sets up the grids for breaks (1,...,100) and mus (.2,.4,...,20)
compute breaks=%seqa(1.0,1.0,100)
compute mus =%seqa( .2, .2,100)
and this generates the corresponding function values over all combinations of the BREAKS and MUS:
dec rect f(100,100)
ewise f(i,j)=-50.0*log((x2-2*mus(i)*over(fix(breaks(j)))+(100-breaks(j))*mus(i)^2)/100.0)
This does the contour graph itself. By default, this determines the spacing (in the function values) for the contours. GCONTOUR offers options to control those.
gcontour(footer="Contour of likelihood for break",x=mus,y=breaks,f=f,vgrid=||50||)
Copyright © 2026 Thomas A. Doan