|
Examples / EXAMPLETHREE.RPF |
EXAMPLETHREE.RPF is an example from the Introduction. This generates several series from the original data on the data file (including some which require lags), then runs two linear regressions (with LINREG). It also uses the TABLE and STATISTICS instructions to show basic statistics on the full set of series (with TABLE) and a larger set of statistics (with STATISTICS).
Full Program
calendar(m) 1959:1
open data ExampleThree.xls
data(format=xls,org=columns) 1959:1 1996:2 rate m1 m2 ip ppi
**********************************************************************
* Generating statistics
**********************************************************************
table
statistics rate
**********************************************************************
* Data transformations and new series
**********************************************************************
set ppidiff = ppi-ppi{1}
set m1diff = m1-m1{3}
set grm2 = (m2-m2{1})/m2{1}
set grppi = (ppi-ppi{1})/ppi{1}
set pratio = ppidiff/ppi
set ppisum = pratio + pratio{1} + pratio{2}
**********************************************************************
* Linear regressions
**********************************************************************
linreg rate
# constant ip m1diff ppisum
linreg rate
# constant ip grm2 grppi{1}
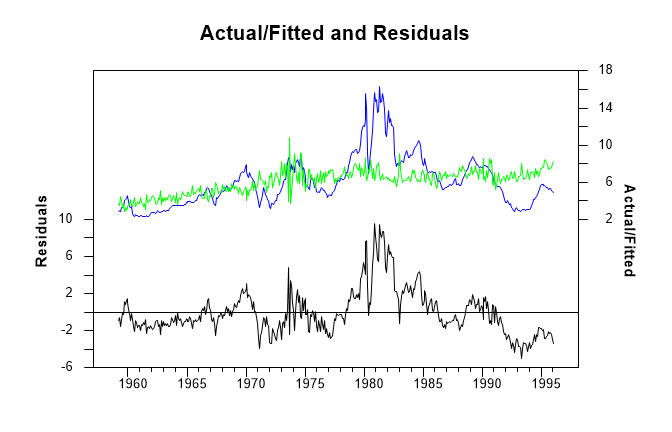
@regactfit
Output
Series Obs Mean Std Error Minimum Maximum
RATE 446 6.05858744 2.77510466 2.27000000 16.29000000
M1 446 448.06255605 312.00002739 138.90000000 1152.30000000
M2 446 1577.37847534 1141.42636764 286.60000000 3673.10000000
IP 446 57.46704036 16.87177721 27.40000000 91.30000000
PPI 446 71.52242152 34.84734464 31.30000000 126.30000000
Statistics on Series RATE
Monthly Data From 1959:01 To 1996:02
Observations 446
Sample Mean 6.058587 Variance 7.701206
Standard Error 2.775105 SE of Sample Mean 0.131405
t-Statistic (Mean=0) 46.106212 Signif Level (Mean=0) 0.000000
Skewness 1.186328 Signif Level (Sk=0) 0.000000
Kurtosis (excess) 1.587381 Signif Level (Ku=0) 0.000000
Jarque-Bera 151.440700 Signif Level (JB=0) 0.000000
Linear Regression - Estimation by Least Squares
Dependent Variable RATE
Monthly Data From 1959:04 To 1996:02
Usable Observations 443
Degrees of Freedom 439
Centered R^2 0.2526958
R-Bar^2 0.2475890
Uncentered R^2 0.8717009
Mean of Dependent Variable 6.0806546275
Std Error of Dependent Variable 2.7714419161
Standard Error of Estimate 2.4039938631
Sum of Squared Residuals 2537.0628709
Regression F(3,439) 49.4816
Significance Level of F 0.0000000
Log Likelihood -1015.1499
Durbin-Watson Statistic 0.0816
Variable Coeff Std Error T-Stat Signif
************************************************************************************
1. Constant 2.11841571 0.42030566 5.04018 0.00000068
2. IP 0.06417324 0.00768853 8.34662 0.00000000
3. M1DIFF -0.04183328 0.01485687 -2.81575 0.00508547
4. PPISUM 58.26459284 8.01033322 7.27368 0.00000000
Linear Regression - Estimation by Least Squares
Dependent Variable RATE
Monthly Data From 1959:03 To 1996:02
Usable Observations 444
Degrees of Freedom 440
Centered R^2 0.2215769
R-Bar^2 0.2162694
Uncentered R^2 0.8660034
Mean of Dependent Variable 6.0733783784
Std Error of Dependent Variable 2.7725545963
Standard Error of Estimate 2.4545026092
Sum of Squared Residuals 2650.8165458
Regression F(3,440) 41.7484
Significance Level of F 0.0000000
Log Likelihood -1026.6780
Durbin-Watson Statistic 0.1730
Variable Coeff Std Error T-Stat Signif
************************************************************************************
1. Constant 1.20988109 0.52637190 2.29853 0.02199968
2. IP 0.06525852 0.00727000 8.97641 0.00000000
3. GRM2 136.19299812 34.77735583 3.91614 0.00010426
4. GRPPI{1} 101.94478474 17.17615119 5.93525 0.00000001
Graphs
This is created by the @RegActFit procedure based upon the second regression.
Copyright © 2026 Thomas A. Doan