|
Examples / SCTEST.RPF |
SCTEST.RPF provides examples of several different tests for (univariate) serial correlation. This uses one of the series from West and Cho(1995).
The raw data are (log) weekly exchange rates, which are transformed to weekly returns. The specific series used is the Canadian $ to US $.
set xcan = 100.0*(scan-scan{1})
First up is is a battery of Q tests using CORRELATE with the QSTATS option. (Output).
correlate(qstats,number=40,span=10) xcan
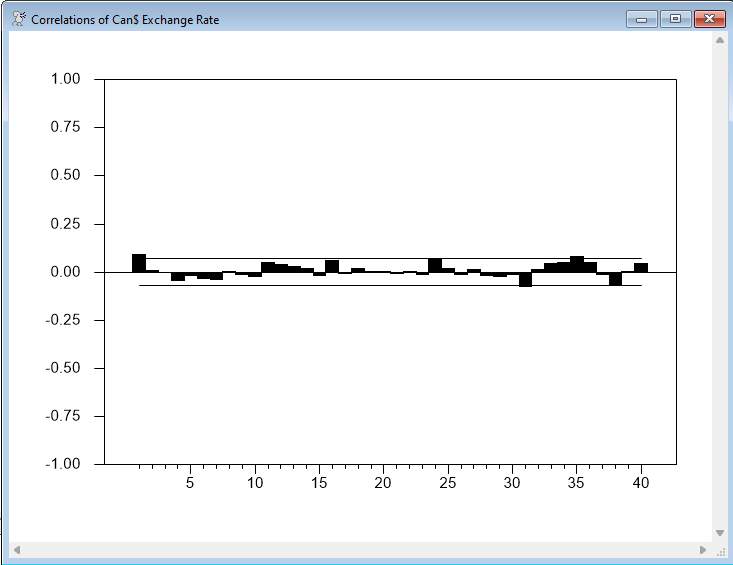
Next, it does the same type of test using the procedure @REGCORRS, which also will produce both a table of correlations and tests, and a graph of the autocorrelations. The overall impression here is that there may be some autocorrelation at lag 1 (only) that might be worth some attention.
@regcorrs(number=40,graph,report,nocrit,$
title="Correlations of Can$ Exchange Rate") xcan
The West-Cho test does a form of Q test allowing for heteroscedasticity in the series. (Output). This fails to reject at any standard significance level.
@westchotest(number=40) xcan
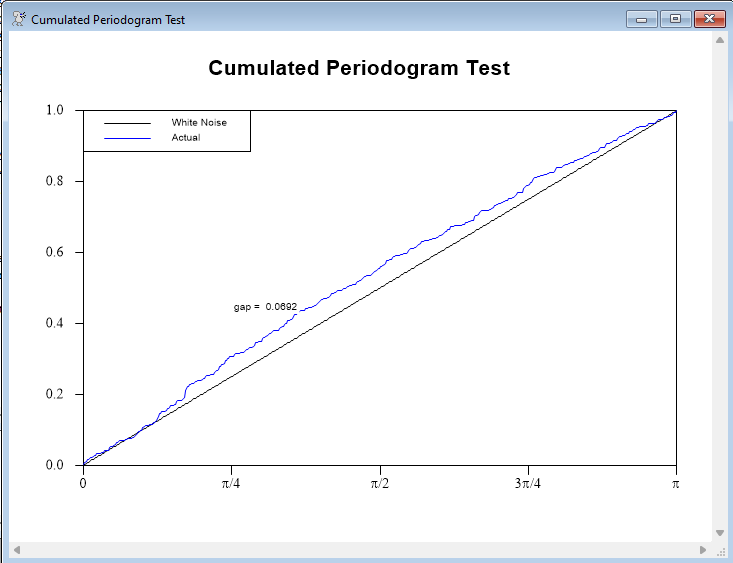
The cumulated periodogram test does a test for white noise in the frequency domain. This provides both a report on the Kolmogorov-Smirnov test, and a graph of the difference between the observed spectrum and the spectrum of white noise. The largest gap is between the .01 and .05 significance level.
@cumpdgm xcan
Full Program
open data westcho_xrate.xls
calendar(w) 1973:3:7
data(format=xls,org=col) 1973:03:07 1989:09:20 scan sfra sger sita sjap sukg
*
set xcan = 100.0*(scan-scan{1})
*
* Battery of Q tests done using CORRELATE
*
correlate(qstats,number=40,span=10) xcan
*
* Same thing using @REGCORRS
*
@regcorrs(number=40,graph,report,nocrit,$
title="Correlations of Can$ Exchange Rate") xcan
*
* Using @WestChoTest
*
@westchotest(number=40) xcan
*
* Using @CUMPDGM
*
@cumpdgm xcan
Output
Weekly Data From 1973:03:14 To 1989:09:20
Autocorrelations
1 2 3 4 5 6 7 8 9 10
0.09126 0.01059 -0.00433 -0.04290 -0.01938 -0.03114 -0.03731 0.00089 -0.01085 -0.02078
11 12 13 14 15 16 17 18 19 20
0.05172 0.03756 0.02916 0.01617 -0.01652 0.05850 -0.00925 0.01757 0.00209 0.00268
21 22 23 24 25 26 27 28 29 30
-0.00872 0.00209 -0.01499 0.06401 0.01788 -0.01342 0.01629 -0.01860 -0.02384 -0.01520
31 32 33 34 35 36 37 38 39 40
-0.07605 0.01279 0.04600 0.04894 0.08262 0.05039 -0.01168 -0.06981 0.00250 0.04865
Ljung-Box Q-Statistics
Lags Statistic Signif Lvl
10 11.793 0.299157
20 19.966 0.460074
30 25.590 0.695899
40 50.117 0.131165
Lag Corr Partial LB Q Q Signif
1 0.091 0.091 7.209804 0.0073
2 0.011 0.002 7.308005 0.0259
3 -0.004 -0.006 7.323984 0.0623
4 -0.043 -0.042 8.919572 0.0631
5 -0.019 -0.012 9.246691 0.0996
6 -0.031 -0.028 10.087041 0.1210
7 -0.037 -0.032 11.299815 0.1261
8 0.001 0.006 11.300310 0.1853
9 -0.011 -0.013 11.405961 0.2489
10 -0.021 -0.022 11.783392 0.2998
11 0.051 0.052 14.100607 0.2275
12 0.037 0.027 15.309519 0.2249
13 0.029 0.020 16.052296 0.2463
14 0.016 0.009 16.280284 0.2966
15 -0.017 -0.016 16.524787 0.3481
16 0.058 0.064 19.482190 0.2445
17 -0.009 -0.016 19.554643 0.2976
18 0.018 0.027 19.834022 0.3422
19 0.002 0.000 19.838705 0.4043
20 0.002 0.009 19.843630 0.4677
21 -0.008 -0.006 19.905371 0.5273
22 0.003 0.007 19.911332 0.5886
23 -0.015 -0.013 20.102517 0.6357
24 0.063 0.064 23.683289 0.4798
25 0.017 0.005 23.954328 0.5220
26 -0.013 -0.012 24.099175 0.5703
27 0.016 0.012 24.325604 0.6122
28 -0.019 -0.018 24.646797 0.6470
29 -0.024 -0.023 25.158258 0.6700
30 -0.014 -0.011 25.340680 0.7083
31 -0.075 -0.069 30.434890 0.4949
32 0.012 0.019 30.563783 0.5392
33 0.045 0.043 32.371697 0.4982
34 0.049 0.042 34.559412 0.4410
35 0.082 0.063 40.596516 0.2373
36 0.049 0.028 42.727440 0.2045
37 -0.011 -0.019 42.836746 0.2350
38 -0.068 -0.073 47.039849 0.1492
39 0.002 0.029 47.041893 0.1765
40 0.047 0.050 49.044173 0.1546
West-Cho Modified Q Test, Series XCAN
Q(40) 44.16
Signif. 0.3001
Cumulated Periodogram Test for Series XCAN
Maximum Gap 0.0692
At Frequency 1.1474
Approximate Rejection Limits
1% 0.0720
5% 0.0601
10% 0.0539
Graphs
Copyright © 2026 Thomas A. Doan