|
Wizards / Graph Wizard |
Selecting the menu operation Data/Graphics>Graph brings up the following dialog box, which allows you to generate time series graphs:
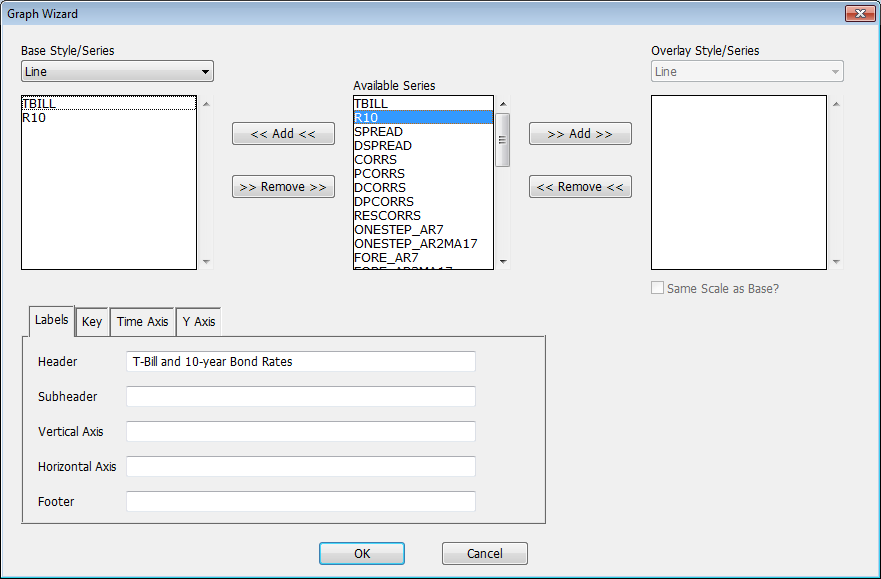
Note that the GRAPH instruction offers many more options than are available with the Wizard. You may find it useful to use the Wizard to generate the basic GRAPH, and then add additional options as desired.
Available Series
The Available Series list in the middle of the dialog box shows all the series. To graph one or more series, select (highlight) the series from the Available Series list, and click on the Add button on the left of the list. This adds those series to the Base Series list.
If you want to graph additional series using a second scale or a different style (what we call an "overlay" graph), select those series from the Available Series list and click on the Add button to the right. Those series will be added to the Overlay Series list.
Base Style/Series and Overlay Style/Series
The Base Style and Overlay Style drop down lists select the style to be used for the "base" and (optional) overlay series. Choices include the default line graph style, filled polygon style, and several bar graph styles. The Base Style on the left of the dialog box applies to the Base Series list, while the Overlay Style on the right applies to the Overlay Series (if any). These generate correspond to the STYLE and OVERLAY options on the GRAPH instruction.
Label and Appearance Fields
Click on the Labels, Key, Time Axis, and Y Axis tabs to add labels to the graph and control other graph appearance settings.
Header, Subheader, Vertical Axis, Horizontal Axis
Use these fields to add labeling to the graph. Respectively, these correspond to the HEADER, SUBHEADER, VLABEL, and HLABEL options on GRAPH.
Key
The fields here allow you to include a key on the graph in any of several positions, and control whether or not a box is displayed around the key.
Time Axis
Use these fields to control the labeling of the horizontal axis and to add vertical grid lines or shading to the graph.
Y Axis
Use these fields to control the appearance and scale of the vertical axis.
Copyright © 2026 Thomas A. Doan